Boltz-2
Introduction
Boltz-2 is a biomolecular structure prediction tool capable of modeling proteins, nucleic acids, ligands, and various biomolecular complexes. The input must be provided in a YAML file describing the system components and calculation parameters.
In this example, the use of Boltz-2 is demonstrated on the crystal structure with the PDB identifier 11CE.
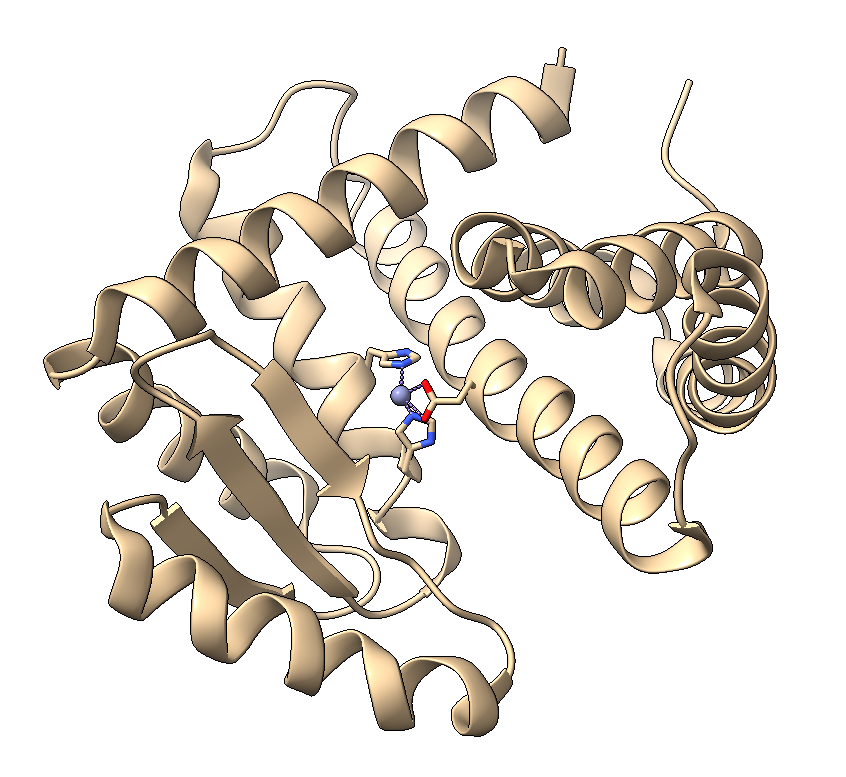
The system consists of a protein and a coordinated zinc ion. To prepare the Boltz-2 input, the following information is extracted from the PDB structure:
the amino acid sequence of the protein,
the presence of bound zinc ion(s),
the chain identifiers.
The goal is to predict the structure of a protein-ligand complex, where the ligand is a doubly positively charged zinc ion.
Downloading the FASTA Sequence from the PDB Database
Open the 11CE entry in the PDB database (https://www.rcsb.org/structure/11CE).
Select the Download Files menu.
Download the FASTA sequence.
Copy the amino acid sequence of the desired chain into the appropriate field of the Boltz-2 YAML input file.
The FASTA file has the following format (rcsb_pdb_11CE.fasta):
>11CE_1|Chain A|The protease-Zn (II) complex of Zn5|synthetic construct (32630)
MSGMTAEELAERIGEALARGRWDEVYALGAYAFLTLTPEEIEEMRRRLREVLREELKKLGKTYSDEEVDRLVEAAVYEGEASAVVVRRYREEGLPEDMTDEQLFELGMLHEAYHVNFGDAYVVADGKEGIVEVLVARTEEELEEARRLAERAREEGKEVRFFKKGEEEAVIEWLREVAEKYPKVREGLIEGTRRLLEEYRKIVGSAWSHPQFEK
Creating a Boltz-2 Input File
The protein and zinc ion are specified in YAML format (11CE.yaml):
version: 1

sequences:
  - protein:
      id: A
      sequence: MSGMTAEELAERIGEALARGRWDEVYALGAYAFLTLTPEEIEEMRRRLREVLREELKKLGKTYSDEEVDRLVEAAVYEGEASAVVVRRYREEGLPEDMTDEQLFELGMLHEAYHVNFGDAYVVADGKEGIVEVLVARTEEELEEARRLAERAREEGKEVRFFKKGEEEAVIEWLREVAEKYPKVREGLIEGTRRLLEEYRKIVGSAWSHPQFEK

  - ligand:
      id: ZN
      smiles: "[Zn+2]"
Running the Calculation
The calculation can be started by specifying the YAML input file.
Using the online MSA service:
boltz predict 11CE.yaml --use_msa_server
If the required databases are available locally, MSAs can also be generated on the local machine:
boltz predict 11CE.yaml
During execution, Boltz-2 automatically creates the required working directories, generates the MSAs, performs the structure prediction, and calculates the confidence metrics.
Output Files
After the calculation is completed, Boltz creates an output directory derived from the name of the input file. The directory structure is similar to the following:
boltz_results_11CE/
├── predictions/
│   └── 11CE/
│       ├── 11CE_model_0.cif
│       ├── confidence_11CE_model_0.json
│       └── ...
├── processed/
├── lightning_logs/
└── msa/
The most important files and directories are:
predictions/11CE/Directory containing the prediction results.
-
The predicted structure in mmCIF format. This file can be opened directly in Maestro, ChimeraX, or PyMOL.
-
Contains reliability and confidence metrics associated with the predicted model. Among other values, it includes estimated structural uncertainty and model confidence scores.
processed/Contains input files preprocessed by Boltz. These files are generated automatically during execution.
lightning_logs/Stores log files and runtime information generated by PyTorch Lightning.
msa/Directory used for storing multiple sequence alignments (MSAs). If MSA generation was performed during the calculation, the files found here are used as input for the prediction model.
For the analyses presented in the following sections, we will primarily
use the 11CE_model_0.cif file, which contains the structural model
ranked highest by Boltz.
Note
Some calculations may generate multiple models. In such cases,
several model_* files will appear in the predictions
directory. For further analysis, it is generally recommended
to use the model with the highest confidence score.
Visualizing the Predicted Structure
The structure obtained in CIF format can be opened using several molecular visualization programs.
Commonly used software packages include:
PyMOL
UCSF ChimeraX
VMD
For example, in ChimeraX:
File → Open → 11CE_model_0.cif
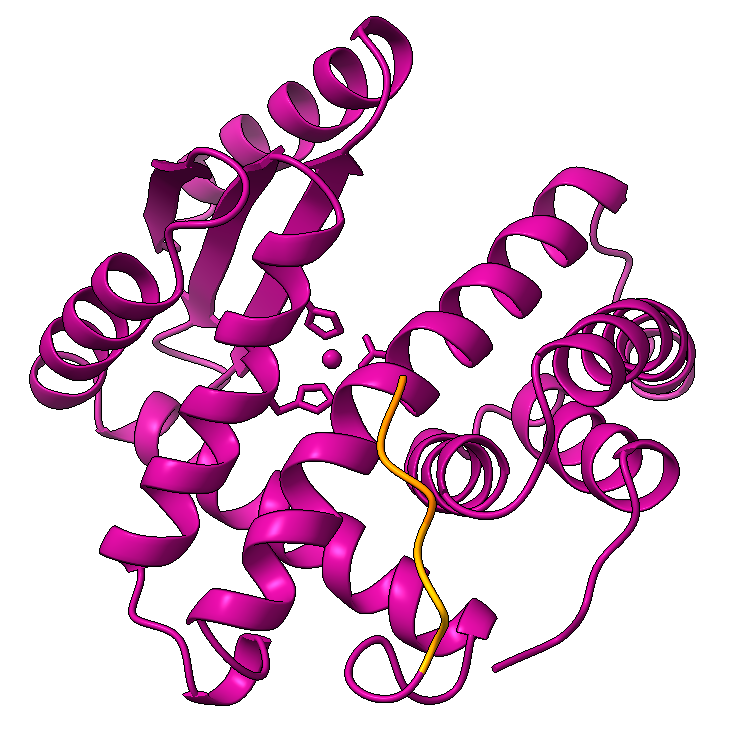
After loading the structure, the position of the zinc ion and its predicted coordination environment can be inspected.
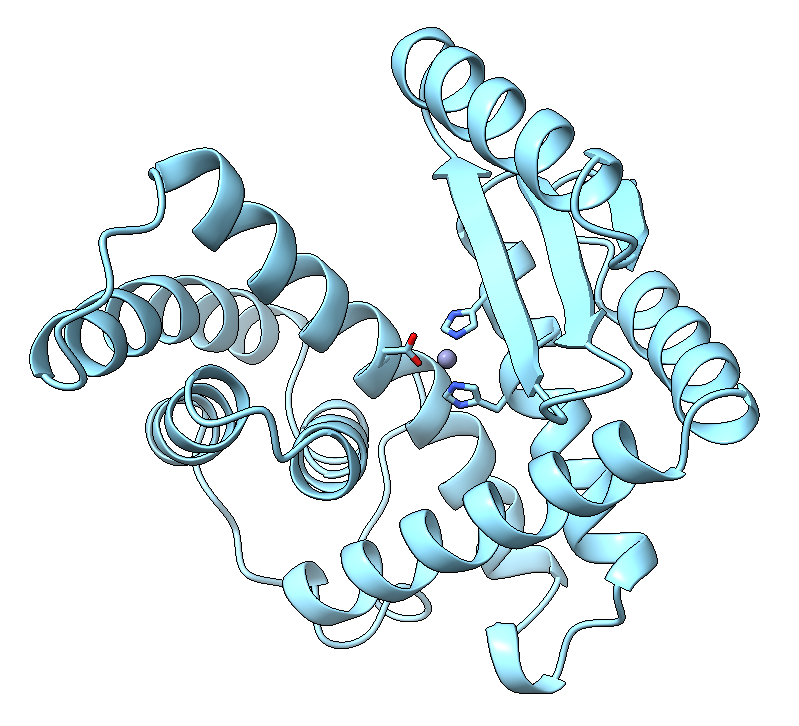
Assessing Prediction Confidence
In addition to examining pLDDT values, it is also useful to inspect the prediction error estimated by AlphaFold.
For this purpose, the built-in AlphaFold tools available in ChimeraX can be used.
From the menu bar, select:
Tools → Structure Prediction → AlphaFold Error Plot
In the window that opens, select 11CE_model_0.cif in the
structure field and choose the
file (.json or .npy or .npz or .pkl) option in the
Predicted aligned error (PAE) from: field.
Ensure that the directory containing the .cif file also contains
the output files corresponding to the PAE, pLDDT, and pDE metrics.
A new window will then display the so-called Predicted Aligned Error (PAE) matrix.
The PAE indicates the positional error estimated by AlphaFold for the relative placement of any two amino acid residues.
Interpreting the Plot
Both axes of the diagram correspond to the amino acid residues of the protein.
Each pixel represents the estimated error associated with a particular pair of residues:
low value → high confidence
high value → uncertain relative positioning
The color scale is typically interpreted as follows:
Color |
Interpretation |
|---|---|
Dark blue |
Very low estimated error |
Light blue |
Low estimated error |
Yellow |
Moderate uncertainty |
Orange/Red |
High estimated error |
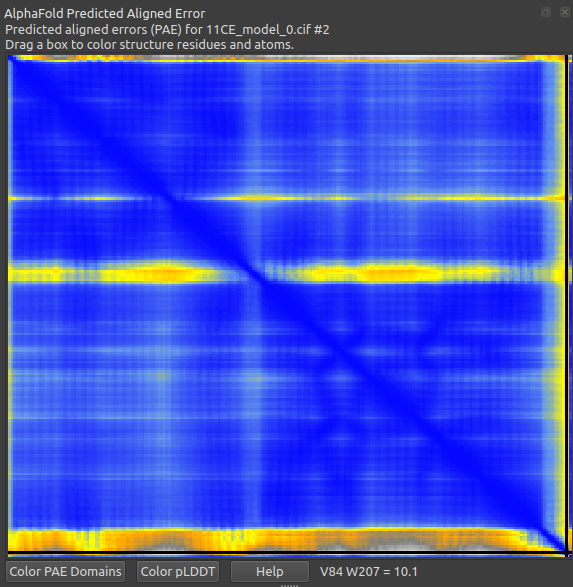
The buttons located below the plot can be used to color the protein according to either the PAE or pLDDT values, enabling easier identification of reliable and uncertain regions within the predicted structure.
The Difference Between PAE and pLDDT
The pLDDT score reflects the local accuracy of individual amino acid residues.
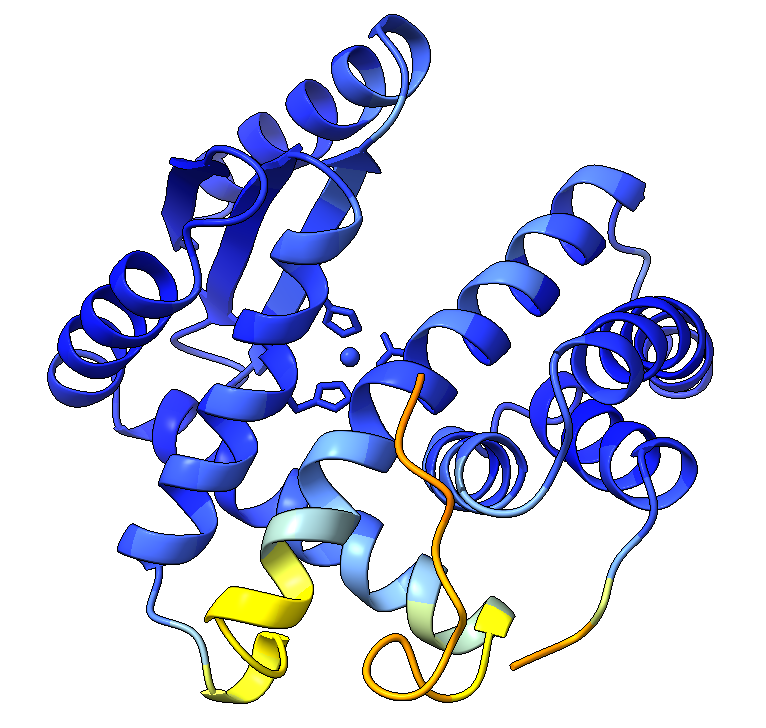
In contrast, the PAE indicates how reliable the relative positioning of two regions of the structure is.
This is particularly important for:
multidomain proteins,
protein complexes,
homodimers and heterodimers.
Comparison of the Prediction with the Crystal Structure
The model generated by Boltz-2 can be compared with the original
11CE crystal structure. Structural superposition was performed
using the UCSF ChimeraX Matchmaker algorithm.
Predicted structure:
11CE_model_0.cif
Reference structure:
11ce.pdb
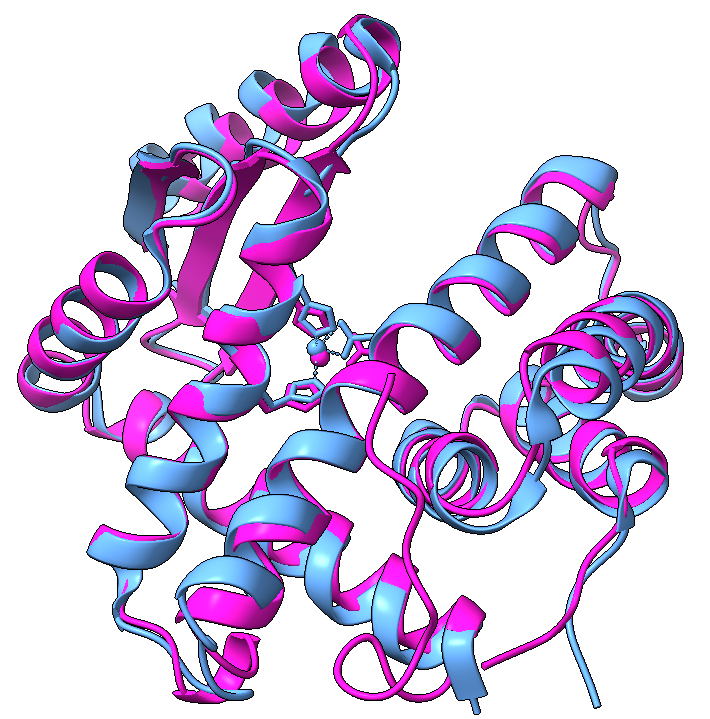
In the figure, the crystal structure is shown in blue, while the structure predicted by Boltz-2 is shown in pink.
The result of the structural alignment is:
Matchmaker 11CE_model_0.cif, chain A (#2)
with 11ce.pdb, chain A (#1),
sequence alignment score = 1059.7

RMSD between 191 pruned atom pairs is 0.822 angstroms;
(across all 203 pairs: 1.334)
The RMSD value is 0.822 Å for the 191 atom pairs retained by Matchmaker, indicating excellent agreement between the predicted structure and the experimentally determined crystal structure.
When all aligned atom pairs are considered, the RMSD is 1.334 Å, which still reflects a high degree of structural similarity.
Based on these results, Boltz-2 successfully reproduces the global fold of the 11CE structure as well as the structural motifs involved in zinc binding.
Interpretation of the Results
In general:
RMSD < 1 Å: excellent agreement
RMSD 1-2 Å: very good agreement
RMSD 2-4 Å: acceptable global structure
RMSD > 4 Å: significant deviation
The RMSD value of 0.822 Å obtained for the 11CE example indicates that Boltz-2 generated a conformation that is extremely close to the native structure.
This example demonstrates that Boltz-2 is capable of highly accurate structure prediction for relatively simple protein-metal ion systems.
Further Applications
The example presented above demonstrates a complete workflow for a simple protein-metal ion system. However, Boltz-2 is also capable of handling considerably more complex biomolecular systems.
Protein Complexes Containing Multiple Chains
If the system contains multiple protein chains, each chain must be
defined separately within the sequences section.
For example, for a homodimer or heterodimer consisting of chains A and B:
version: 1

sequences:
  - protein:
      id: A
      sequence: MSEQNNTEMTFQIQRIYTKDISFEAPNAPHVFQ

  - protein:
      id: B
      sequence: MPEEKSAVTALWGKVNVDEVGGEALGRLLVV
In such cases, Boltz-2 predicts not only the structures of the individual chains but also their relative arrangement within the complex.
Protein-Ligand Complexes
Small-molecule ligands can be specified using SMILES notation.
Example of adding an ATP molecule:
version: 1

sequences:
  - protein:
      id: A
      sequence: MSEQNNTEMTFQIQRIYTKDISFEAPNAPHVFQ

  - ligand:
      id: ATP
      smiles: "Nc1ncnc2n(cnc12)COP(O(O)=O)[C@@H]..."
Boltz-2 attempts to determine the most probable binding site and orientation of the ligand relative to the protein.
Systems Containing Nucleic Acids
Boltz-2 is also capable of modeling DNA and RNA sequences.
Single-Stranded DNA Example
version: 1

sequences:
  - dna:
      id: D
      sequence: ATGCGATCGATCGATCGATC
Single-Stranded RNA Example
version: 1

sequences:
  - rna:
      id: R
      sequence: AUGCGAUCGAUCGAUCGAUC
Protein-DNA Complex
A protein and a DNA molecule can also be defined together within the same input file.
version: 1

sequences:
  - protein:
      id: A
      sequence: MKTAYIAKQRQISFVKSHFSRQLEERLGLIEVQ

  - dna:
      id: D
      sequence: ATCGATCGATCGATCGATCG
In this case, the program predicts not only the structure of the individual components but also the relative arrangement of the protein and nucleic acid within the complex.
Protein-Ligand-Ion Systems
Different molecular components can be freely combined.
For example, a protein, an ATP molecule, and a magnesium ion:
version: 1

sequences:
  - protein:
      id: A
      sequence: MSEQNNTEMTFQIQRIYTKDISFEAPNAPHVFQ

  - ligand:
      id: ATP
      smiles: "Nc1ncnc2n(cnc12)[C@@H]3O[C@H](COP(O)(O)=O- ligand:
      id: MG
      smiles: "[Mg+2]"
Covalently Bound Ligands
Boltz-2 also supports the treatment of covalently attached modifications. In such cases, bonds between molecules must be explicitly defined in the appropriate section of the input file.
Typical applications include:
phosphorylation,
glycosylation,
covalent inhibitors,
chromophores,
prosthetic groups.
Complex Systems
The most complex inputs may contain multiple proteins, nucleic acids, ligands, and ions simultaneously.
For example:
version: 1

sequences:
  - protein:
      id: A
      sequence: ...

  - protein:
      id: B
      sequence: ...

  - dna:
      id: D
      sequence: ...

  - ligand:
      id: ATP
      smiles: ...

  - ligand:
      id: MG
      smiles: "[Mg+2]"
Such systems can be used to investigate transcription factors, enzyme complexes, or ribonucleoprotein assemblies.