AlphaFold 3
Introduction
AlphaFold is an artificial intelligence-based structure prediction system developed by DeepMind that can predict the three-dimensional structures of proteins, nucleic acids, ligands, and their complexes.
In this example, the 2V0X structure available in the PDB database is used as a reference. The aim is to demonstrate how to prepare an input file, launch a calculation, and evaluate the obtained results.
Reference Structure
The 2V0X structure contains the dimerization domain of the LAP2α protein. The structure was determined by X-ray diffraction at a resolution of 2.2 Å, and the biologically relevant assembly is a homodimer. The structure contains two chains (A and B).
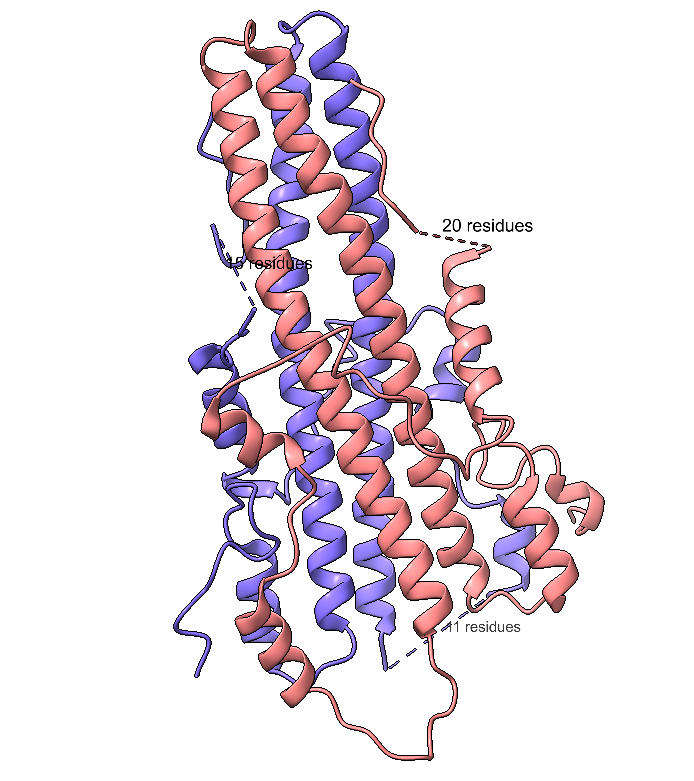
Main characteristics of the structure:
PDB Identifier |
2V0X |
|---|---|
Organism |
Mus musculus |
Method |
X-ray diffraction |
Resolution |
2.20 Å |
Biological assembly |
Homodimer |
Workflow Overview
The prediction workflow consists of four main steps:
Extracting the protein sequence
Creating an AlphaFold 3 JSON input file
Running the prediction
Comparing the results with the experimental structure
Sequence Preparation
The primary input for AlphaFold 3 is the sequence of the biomolecule being studied. For proteins, this is the amino acid sequence, while for DNA or RNA it is the nucleotide sequence.
If an experimentally determined structure is already available for the target protein (e.g., X-ray crystallography, NMR, or cryo-EM data), the sequence can be easily extracted from the Protein Data Bank (PDB). PDB records generally include FASTA-formatted sequences for each chain, which can be used directly as AlphaFold 3 input.
For example, in the case of the 2V0X structure, the FASTA sequence of the chains can be downloaded from the PDB or PDBe website and inserted directly into the appropriate field of the JSON input file.
If no experimental structure is available, the sequence may originate from several different sources:
a protein record in the UniProt database;
genome or transcriptome annotations;
translation of a gene sequence;
a sequence reported in the scientific literature;
a newly determined protein sequence obtained in the laboratory.
In such cases, the AlphaFold 3 prediction often provides the first available structural model for the protein of interest.
It is important to note that AlphaFold does not require an experimental structure to operate. The program primarily generates structural predictions from the provided sequence by combining evolutionary information and neural network models. This enables the modeling of proteins for which no structural information has previously been available.
In the present example, the 2V0X protein is used for demonstration purposes. Since an experimental structure is available for this protein, the prediction results can be directly compared with the reference structure, allowing an objective evaluation of AlphaFold 3 performance.
Downloading the FASTA Sequence from the PDB Database
Open the 2V0X entry on the PDB website (https://www.rcsb.org/structure/2V0X).
Select the Download Files menu.
Download the FASTA sequence.
Copy the amino acid sequence of the desired chain into the appropriate field of the AlphaFold 3 JSON input file.
The FASTA format follows a structure similar to the example below
(rcsb_pdb_2V0X.fasta):
>2V0X_1|Chains A, B|LAMINA-ASSOCIATED POLYPEPTIDE 2 ISOFORMS ALPHA/ZETA|MUS MUSCULUS (10090)
AKSVVSHSLTTLGVEVSKPPPQHDKIEASEPSFPLHESILKVVEEEWQQIDRQLPSVACRYPVSSIEAARILSVPKVDDEILGFISEATPAAATQASSTESCDKHLDLALCRSYEAAASALQIAAHTAFVAKSLQADISQAAQIINSDPSDAQQALRILNRTYDAASYLCDAAFDEVRMSACAMGSSTMGRRYLWLKDCKISPASKNKLTVAPFKGGTLFGGEVHKVIKKRGNKQ
Input JSON File Creation
AlphaFold 3 uses a JSON-formatted input file to run structure predictions. The file contains the sequence(s) of the biomolecule(s) to be studied, the name of the prediction job, and the basic parameters required for model configuration.
In this example, we demonstrate the prediction of one chain from the 2V0X structure.
The structure of the input JSON file
(lap2alpha_dim.json)
is shown below:
{
  "name": "2V0X_dimer",
  "modelSeeds": [1],
  "sequences": [
    {
      "protein": {
        "id": ["A","B"],
        "sequence": "AKSVVSHSLTTLGVEVSKPPPQHDKIEASEPSFPLHESILKVVEEEWQQIDRQLPSVACRYPVSSIEAARILSVPKVDDEILGFISEATPAAATQASSTESCDKHLDLALCRSYEAAASALQIAAHTAFVAKSLQADISQAAQIINSDPSDAQQALRILNRTYDAASYLCDAAFDEVRMSACAMGSSTMGRRYLWLKDCKISPASKNKLTVAPFKGGTLFGGEVHKVIKKRGNKQ"
      }
    }
  ],
  "dialect": "alphafold3",
  "version": 1
}
Explanation of JSON Fields
nameA unique name for the prediction run. The generated results are typically stored in a subdirectory named after this value within the output directory.
modelSeedsInitialization values for the random number generator used by AlphaFold. Using a single seed produces a single prediction.
Example:
"modelSeeds": [1]
Multiple seeds can be specified to generate several independent models:
"modelSeeds": [1, 2, 3, 4, 5]
This may increase the likelihood of identifying the most favorable conformation.
sequencesA list of biomolecules included in the prediction. For a simple protein structure prediction, the list usually contains a single protein object.
idThe chain identifier. For a single protein, the identifier is typically
A.sequenceThe amino acid sequence of the protein written using one-letter amino acid codes, without spaces or line breaks.
dialectThe name of the JSON format specification used by AlphaFold 3.
versionThe version number of the JSON specification.
Modeling Complexes
AlphaFold 3 can process multiple chains simultaneously. For homodimers or heterodimers, it is generally recommended to define each chain as a separate object.
Example of a two-chain complex:
{
  "name": "protein_complex",
  "modelSeeds": [1],
  "sequences": [
    {
      "protein": {
        "id": "A",
        "sequence": "SEQUENCE_A"
      }
    },
    {
      "protein": {
        "id": "B",
        "sequence": "SEQUENCE_B"
      }
    }
  ],
  "dialect": "alphafold3",
  "version": 1
}
Important Notes
Protein sequences must always be specified within the
proteinfield.For DNA sequences, use the
dnakeyword.For RNA sequences, use the
rnakeyword.The FASTA header (the line beginning with the
>character) must not be included in the JSON file.Sequences may contain only valid one-letter biological codes.
Based on the provided sequence, AlphaFold 3 automatically searches evolutionary databases and incorporates the resulting information into the structure prediction process.
After preparing the input JSON file, the next step is to launch the prediction within the AlphaFold 3 environment.
Directory Structure and Execution
Before starting an AlphaFold 3 calculation, it is useful to review the project directory structure. The workflow requires the container environment, model parameters, genetic databases, and dedicated input and output directories.
Directory Structure
The following directory structure is used in this example:
0_ai_params/
├── alphafold3/
├── alphafold3.sif
├── af3-model/
├── genetic_db/
├── testinp/
└── testout/
alphafold3/Directory containing the AlphaFold 3 source code. Among other files, it contains the executable script
run_alphafold.py.alphafold3.sifSingularity container image used to run AlphaFold 3.
af3-model/Directory containing the neural network model parameters.
genetic_db/Databases required for MSA searches and feature generation.
testinp/Location of the input JSON files.
testout/Destination directory for results generated by AlphaFold.
Selecting the Working Directory
Before starting the calculation, switch to the alphafold3 directory.
cd ~/0_ai_params/alphafold3
The current working directory can be verified with the following command:
pwd
Expected output:
/home/<username>/0_ai_params/alphafold3
Throughout the remainder of this documentation, all commands are executed from this directory.
This is important because the
run_alphafold.py
script is invoked using a relative path, therefore it must be accessible from the current working directory.
Verifying the Input File
Before launching the prediction, it is recommended to verify that the input file is available.
ls -lh ~/0_ai_params/testinp
For example:
lap2alpha_dim.json
If the file cannot be found, AlphaFold will terminate with an error at the beginning of the execution.
Running the Prediction
The calculation is performed inside a Singularity container.
singularity exec \
  --nv \
  --bind $HOME/0_ai_params/testinp:/root/af_input \
  --bind $HOME/0_ai_params/testout:/root/af_output \
  --bind $HOME/0_ai_params/af3-model:/root/models \
  --bind $HOME/0_ai_params/genetic_db:/root/public_databases \
  ../alphafold3.sif \
  python run_alphafold.py \
  --json_path=/root/af_input/lap2alpha_dim.json \
  --model_dir=/root/models \
  --db_dir=/root/public_databases \
  --output_dir=/root/af_output
Since the command is executed from the alphafold3 directory, the
Singularity image is available from the parent directory:
../alphafold3.sif
Alternatively, the absolute path may also be used:
~/0_ai_params/alphafold3.sif
singularity execExecutes a command inside the Singularity container.
--nvMakes the NVIDIA GPU and CUDA environment available within the container.
--bindMounts directories into the container.
testinp→ input JSON filestestout→ output resultsaf3-model→ model parametersgenetic_db→ reference databases
../alphafold3.sifThe AlphaFold 3 container image to be executed.
python run_alphafold.pyLaunches the main AlphaFold 3 execution program.
--json_pathInput JSON file for the prediction.
--model_dirDirectory containing the neural network parameters.
--db_dirLocation of the databases required for MSA generation.
--output_dirDirectory where the results will be saved.
During execution, the program:
reads the JSON input,
performs Multiple Sequence Alignment (MSA) searches,
generates the required features,
runs the neural network,
refines the predicted structure,
saves the results to the output directory.
After a successful run, the prediction results will appear in the
testout directory. Their interpretation and analysis are presented in the
next chapter.
Output Files
After a successful run, AlphaFold 3 generates the results in the specified output directory.
In this example, based on the name defined in the input JSON file, the resulting directory structure is as follows:
testout/
└── 2V0X_dimer/
    ├── 2V0X_dimer_confidences.json
    ├── 2V0X_dimer_data.json
    ├── 2V0X_dimer_model.cif
    ├── 2V0X_dimer_ranking_scores.csv
    ├── 2V0X_dimer_summary_confidences.json
    ├── seed-1_sample-0/
    └── ...
2V0X_dimer_model.cifAn mmCIF-format file containing the predicted protein structure.
This file can be opened and visualized using:
PyMOL
ChimeraX
Mol*
Most structural analyses are performed using this file.
2V0X_dimer_confidences.jsonContains detailed confidence metrics.
The file includes AlphaFold confidence values for each amino acid residue, making it possible to identify well-modeled regions as well as regions with lower prediction confidence.
2V0X_dimer_summary_confidences.jsonContains a summary of the most important confidence metrics.
The following values are typically found in this file:
pLDDT
pTM
ipTM
ranking score
This is usually the first file to inspect when performing a quick quality assessment of a prediction.
2V0X_dimer_ranking_scores.csvContains the scores used to rank generated models.
When multiple seeds or samples are used, this file can be used to determine which prediction is considered the best.
2V0X_dimer_data.jsonSummary of the input data and metadata used during the run.
It may be useful for reproducing the calculation and reviewing the settings that were applied.
seed-1_sample-0.zipA subdirectory containing detailed files generated during the creation of a specific sample.
Additional directories of this type may appear when multiple seeds or samples are used.
Interpreting Confidence Metrics
The primary indicator of model quality is the pLDDT score.
pLDDT |
Interpretation |
|---|---|
90-100 |
Very high confidence |
70-90 |
Good-quality model |
50-70 |
Moderate confidence |
<50 |
Low confidence |
In general, well-defined structural elements such as α-helices and β-sheets receive high pLDDT scores, whereas flexible or intrinsically disordered regions tend to display lower confidence values.
In the next chapter, we will demonstrate how to visualize the
2V0X_dimer_model.cif file and compare it with the reference 2V0X structure.
Visualizing the Predicted Structure in ChimeraX
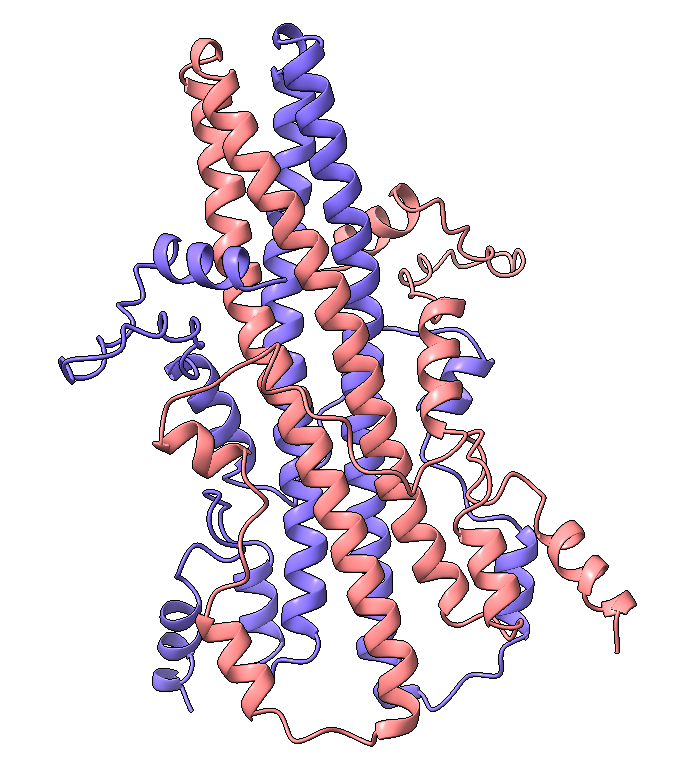
The structure generated by AlphaFold 3 is stored in the
2V0X_dimer_model.cif file.
In this example, the UCSF ChimeraX program will be used to view the model.
Opening the Structure
After launching ChimeraX, select:
File → Open...
and open the file:
2V0X_dimer_model.cif
Alternatively, the file can be opened directly from the command line:
chimerax 2V0X_dimer_model.cif
Displaying the Structure
For protein visualization, the cartoon representation is most commonly used.
Enter the following command in the ChimeraX command line:
cartoon
To color the model by chain:
color bychain
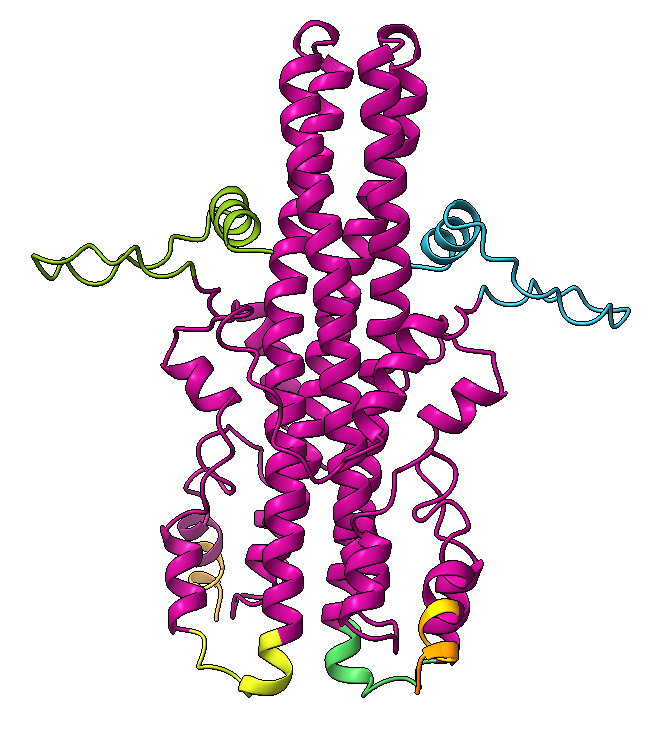
Since a homodimeric structure was modeled in this example, the two chains will be displayed in different colors, making it easier to examine the dimer arrangement.
Examining Prediction Confidence
In addition to displaying pLDDT values, it is often useful to examine the prediction error estimated by AlphaFold.
For this purpose, we use the built-in AlphaFold tools available in ChimeraX.
From the menu bar, select:
Tools → Structure Prediction → AlphaFold Error Plot
The window that opens displays the so-called Predicted Aligned Error (PAE) matrix.
The PAE indicates the positional error estimated by AlphaFold for the relative placement of any pair of amino acid residues.
Interpreting the Plot
Both axes of the diagram represent the amino acid residues of the protein.
Each pixel corresponds to the estimated error for a specific pair of amino acids:
low value → high confidence
high value → uncertain relative position
The color scale is typically interpreted as follows:
Color |
Interpretation |
|---|---|
Dark blue |
Very low estimated error |
Light blue |
Low estimated error |
Yellow |
Moderate uncertainty |
Orange/Red |
High estimated error |
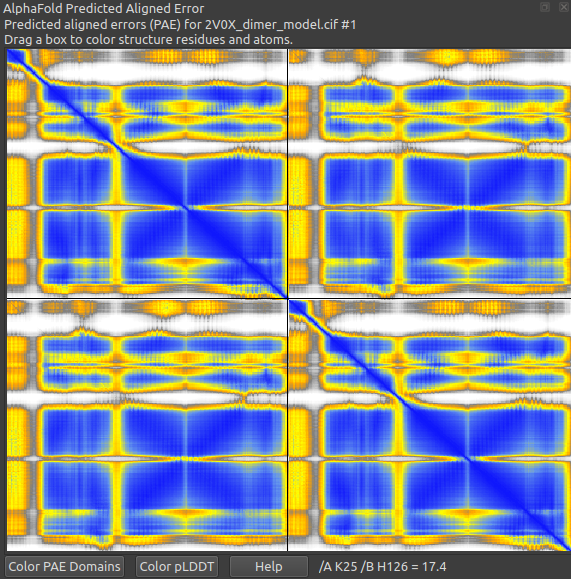
The buttons located below the plot can be used to color the protein according to PAE and pLDDT values.
Difference Between PAE and pLDDT
The pLDDT score indicates the local accuracy of individual amino acid residues.
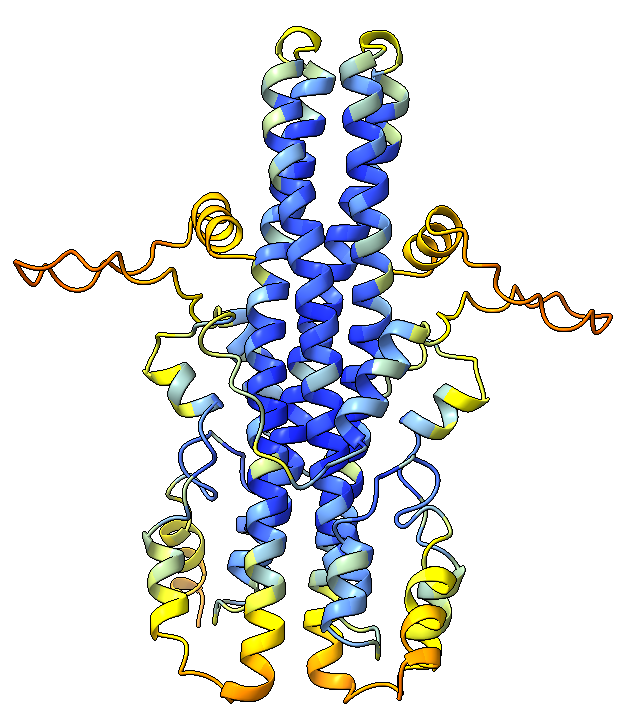
In contrast, PAE indicates how reliable the relative positioning of two regions is with respect to one another.
This is particularly important for:
multi-domain proteins,
protein complexes,
homodimers and heterodimers.
The Case of the 2V0X Homodimer
The 2V0X structure is a homodimer composed of two chains.
Using the Error Plot, it is possible to quickly determine how confident AlphaFold is regarding the orientation of the two chains relative to each other.
For a high-quality prediction, both intra-chain and inter-chain regions display low estimated errors, appearing as continuous dark-green blocks in the plot.
If the regions between the chains show high errors, the model is uncertain about dimer formation or the relative positioning of the chains.
By clicking on the PAE map, ChimeraX highlights the selected amino acids in the three-dimensional structure, making it easy to identify uncertain or poorly defined regions.
This is one of the most useful tools for determining how reliable a predicted dimer structure is.
Loading the Reference Structure
To assess the quality of the prediction, download the reference 2V0X structure from the PDB database.
To open the downloaded file:
File → Open → 2V0X.pdb
ChimeraX will then contain two models:
AlphaFold prediction
Experimental PDB structure
Aligning the Structures
To compare the two models in three-dimensional space, use the
matchmaker command:
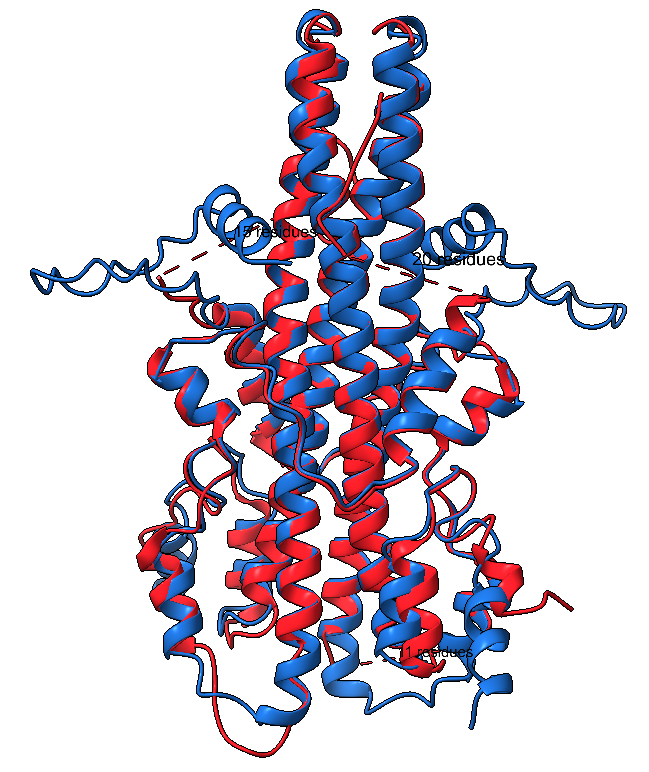
matchmaker #1 to #2
where:
#1is the predicted model#2is the reference structure
ChimeraX automatically performs the structural alignment and reports the RMSD value.
Interpreting the Results
The aligned models can be used to examine:
agreement of secondary structure elements,
correctness of the dimerization interface,
locations of structural differences,
behavior of regions with low pLDDT values.
For 2V0X, it is particularly interesting to evaluate how accurately AlphaFold reconstructs the helical regions responsible for dimerization, which play a key role in the biological function of the protein.
Interpreting the Structural Alignment Results
After running matchmaker, ChimeraX produced the following result:
Matchmaker 2V0X.pdb, chain B (#2) with
2V0X_dimer_model.cif, chain A (#1),
sequence alignment score = 1077.6

RMSD between 164 pruned atom pairs is 0.678 angstroms;
(across all 205 pairs: 4.726)
These results provide several important insights into the quality of the prediction.
Sequence Alignment Score
sequence alignment score = 1077.6
Before performing the structural superposition, MatchMaker carries out a sequence-based alignment. The reported score reflects the quality of this sequence alignment.
The absolute value of the score is generally not meaningful on its own, as it depends strongly on protein length and the alignment parameters used. Consequently, there is no universal threshold that can be considered “good” or “bad”.
A high alignment score, however, indicates that the sequences of the compared chains can be matched well to each other, providing a reliable foundation for the subsequent structural alignment.
In practice, RMSD, pLDDT, and PAE are used much more frequently to assess the quality of a protein structure prediction.
Pruned Atom Pairs
RMSD between 164 pruned atom pairs is 0.678 angstroms
The term pruned indicates that ChimeraX removed atoms or regions that
deviated significantly from the optimal superposition before calculating the
RMSD.
These commonly include:
flexible loop regions,
disordered terminal regions,
structurally uncertain segments of the prediction.
The resulting RMSD therefore characterizes the agreement of the well-aligned core region of the protein.
RMSD for Pruned Atom Pairs
RMSD = 0.678 Å
This value can be considered an excellent agreement.
General guidelines:
RMSD (Å) |
Interpretation |
|---|---|
< 1.0 |
Outstanding agreement |
1-2 |
Very good agreement |
2-4 |
Acceptable agreement |
> 4 |
Significant structural deviation |
An RMSD of 0.678 Å indicates that the structural core of the LAP2α dimerization domain was reproduced with exceptionally high accuracy by AlphaFold 3.
RMSD for All Atom Pairs
(across all 205 pairs: 4.726)
This RMSD value was calculated using all alignable atoms.
The value is substantially larger than the pruned RMSD, suggesting that certain regions of the structures differ significantly from one another.
The most common reasons for this include:
flexible N- or C-terminal regions;
extended loop segments;
regions with low pLDDT scores;
different chain orientations within the dimer.
These regions should be examined together with the PAE map, as the same segments often exhibit elevated predicted errors.
Conclusion
Based on the obtained results, the prediction can be considered highly successful.
The RMSD value of 0.678 Å indicates that the structural core of the LAP2α dimerization domain matches the experimentally determined 2V0X reference structure almost perfectly.
The RMSD of 4.726 Å calculated over all atoms, however, suggests that a few flexible or uncertain regions adopt different conformations. This is a common observation for AlphaFold models and does not necessarily indicate a prediction error, particularly for segments that may also exhibit substantial mobility in the crystal structure.
In this example, AlphaFold 3 successfully reproduced the key structural features of the 2V0X protein, demonstrating the applicability of the method to proteins for which no experimentally determined three-dimensional structure is available.